
Q1/2012 PC Vendor Marketshare
After Apple published their Q1/2012 numbers (Q2 of their fiscal year), here are the graphs for the market share per company for PCs shipped (or sold, as Apple puts it)
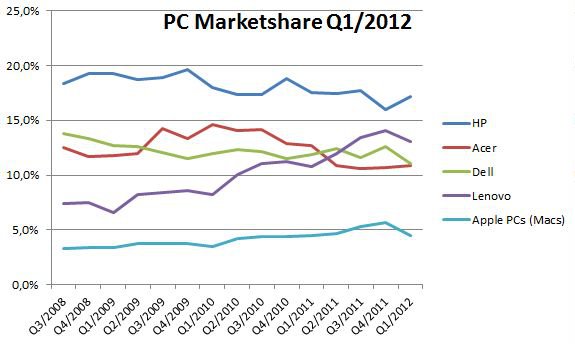
Q1 2012 PC Market Share (ohne iPad)
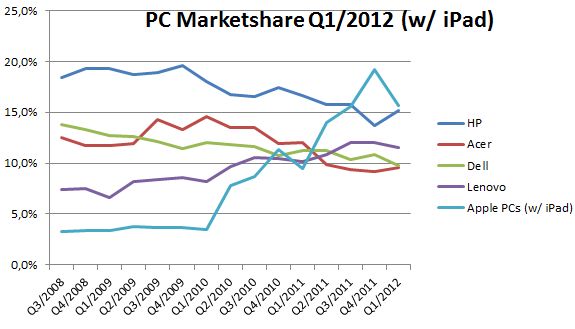
Q1 2012 PC Market Share (inklusive iPad)
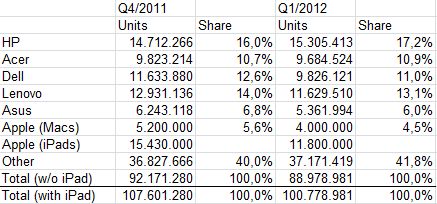
Q1 2012 PC Marktanteile (Stückzahlen)
Analysis:
As predicted by yours truly, HP bounced back and Lenovo sells about 2.6 million more PCs compared to Q1/2011. In particular, HP is the only company in the top five that actually sold more PCs in Q1 than in Q4 of 2011. HP customers are definitiely buying with the company again, even though HPs numbers are a far cry from what they have been before Léo Apotheker announced that HP was going to sell their PC division (which they now aren’t anymore).
All in all the number of PCs shipped in this quarter has risen, but according to Gartner that is because of the emerging markets, not because the numbers bounced back in the first world. But those who predicted that HP was going to sell less and less computers were definitely not right.
With sources reporting that the average retail price of the iPad having dropped by 8% it is kind of obvious that Apple has sold a lot of iPad 2s, which basically means that after selling an initial three million iPad 3s on the first weekend, they either sold every iPad 3 they were able to produce OR the Consumer Reports „iPad 3 is burning your penis“ blog posts resulted in a drop in purchases. Galaxy Note users are free to believe the latter. I think Apple is selling every single iPad 3 they are able to get to customers.
But I have to say it again – the iPad developed its very own market and Apple is basically without competition in it, while the PC market with its small margins has basically been commoditized, with the question remaining why customers are suddenly buying Lenovo Laptops instead of Acer. Maybe their first Acer was also their last? Or maybe Lenovo is quite successful with, let’s say the „Samsung way of designing products“.
If you want it more blunt: Lenovo notebooks look like Macbooks. Acer Notebooks don’t. And Lenovo more than doubled their numbers within the last four years, from 5 million in Q1/2008 to nearly 12 million in Q1/2012.
Also, for the first time in years the number of Macs sold by Apple hasn’t risen. They sell the same four million computers in Q1 of 2012 as they have in Q1/2011. Of course that won’t be a concern for Apple but keep in mind that a mere five years ago this devision that today sells twice the amount it did in 2007, is a mere afterthought in the sales calls, dwarfed by the iPod, iPhone and iPad numbers.
All this considered it is highly likely that the combined PC/iPad graph is going to see Apple re-gain marketshare in the following quarters. But since it’s becoming more and more obvious that the PC market isn’t going away and is going to experience at least a slight growth over the next months and maybe even years due to the emerging markets, one has to wonder if it’s really necessary to put together PC and Tablet iPad numbers.
The problem is: Amazon isn’t publishing concrete numbers for the Kindle Fire. Without those numbers, a graph for Tablet market share would be a horizontal line at 99% for Apple and a flatline for all the other manufacturers. You can’t really put „we sold millions“ into a graph and on top of that, those Kindles most likely are highly subsidized AND they are also only available in the US. Until Amazon goes worldwide with the Kindle Fire, starts selling them at a profit, and they publish numbers, you can’t take the Kindle fire seriously. It’s also highly questionable if they really sold „millions“ when you read reports that only 54% of all Android tablets are Kindle Fires.
So for the time being, we’ll just stick to the two graphs above.

Neueste Kommentare